Satellite Images for Global Climate Change
Climate change refers to any significant change in measures of climate (such as temperature, precipitation, or wind) lasting for an extended period (decades or longer). As though much of its history, the Earth’s climate is changing right now and it is getting warmer. Most of the warming in recent decades is very likely the result of human activities. The National Oceanic and Space Administration’s (NASA) Surface Temperature Analysis indicates the average temperature of the Earth’s surface has increased by about 1.2 to 1.4 degrees Fahrenheit since 1900. Other aspects of the climate are also changing such as precipitation patterns and storms.
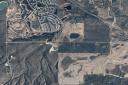

Digital Elevation Model – QuickBird
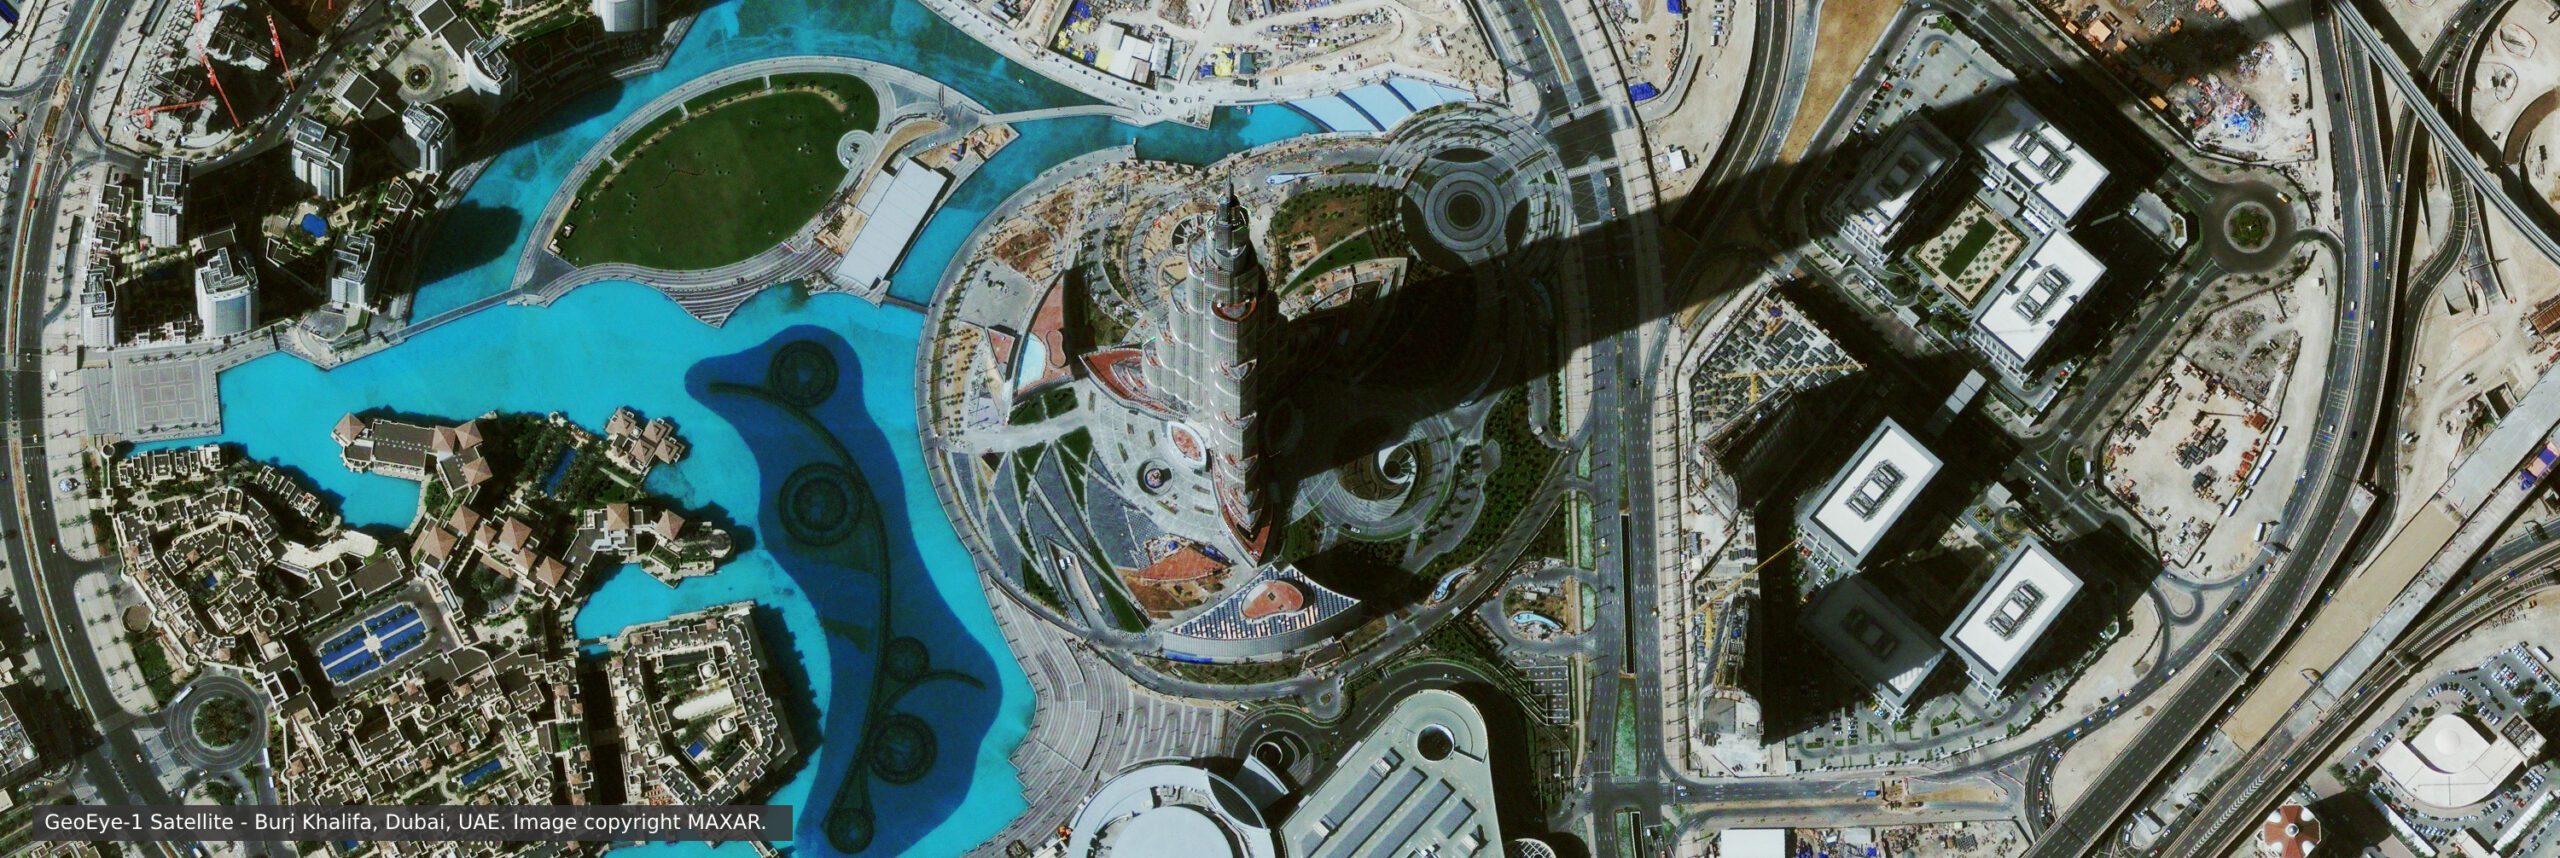
Copyright © MAXAR. All Rights Reserved
During the past century, humans have substantially added to the number of greenhouse gases in the atmosphere by burning fossil fuels such as coal, natural gas, oil, and gasoline to power our cars, factories, utilities, and appliances. The added gases, primarily carbon dioxide and methane are enhancing the natural greenhouse effect and likely contributing to an increase in global average temperature and related climate changes.
Land Cover and Land Use Change
In addition to changes in the atmosphere’s composition, changes in the land surface can have important effects on climate. For example, a change in land use and cover can affect temperature by changing how much solar radiation the land reflects and absorbs. Processes such as deforestation, reforestation, desertification, and urbanization often contribute to changes (including temperature, wind, and precipitation) in the places they occur. These effects may be significant regionally but reduced when averaged over the entire globe.
Color Infrared – Green Vegetation – Soil Index
The extent of these changes has prompted concern about the possible effects on the global physical, chemical, and biological systems. Large-scale changes in land use at rates unprecedented in human history are provoking considerable concern. Land-use change is frequently accompanied by alterations or changes in land cover, which may possibly contribute to subsequent environmental change. Evaluation of static attributes (types, amount, and arrangement) and the dynamic attributes (types and rates of change) on satellite image data may allow the types of change to be regionalized and the proximate sources of change to be identified or inferred. This information, combined with results of case studies or surveys, can provide helpful input to informed evaluations of interactions among the various driving forces.
Satellite image data is expected to contribute to a wide array of global change-related application areas for vegetation and ecosystem dynamics, hazard monitoring, geology, and soil analysis, land surface climatology, hydrology, land cover change, and the generation of orthorectified digital elevation models (DEMs).
Changes in land cover and land use can also affect the amount of carbon dioxide taken up (or sequestered) or released by the land surface. For more information, visit EPA’s Carbon Sequestration in Agriculture and Forestry site.
What’s Known
Scientists know with virtual certainty that:
Human activities are changing the composition of the Earth’s atmosphere. Increasing levels of greenhouse gases like carbon dioxide (CO2) in the atmosphere since pre-industrial times are well documented and understood.
The atmosphere’s buildup of CO2 and other greenhouse gases is largely the result of human activities such as the burning of fossil fuels.
An “unequivocal” warming trend of about 1.0 to 1.7 degrees Fahrenheit occurred from 1906-2005. Warming occurred in both the Northern and Southern Hemispheres and over the oceans.