Satellite Maps to Monitor Climate Change
The Earth, our home in space, is a varied and dynamic place. Since the beginning of human history, we have sought a better understanding of the world around us. With the new technology of the aerospace age and satellite image technology, we can look back and appreciate the diversity and beauty of the Earth in a way not possible until the 20th century.
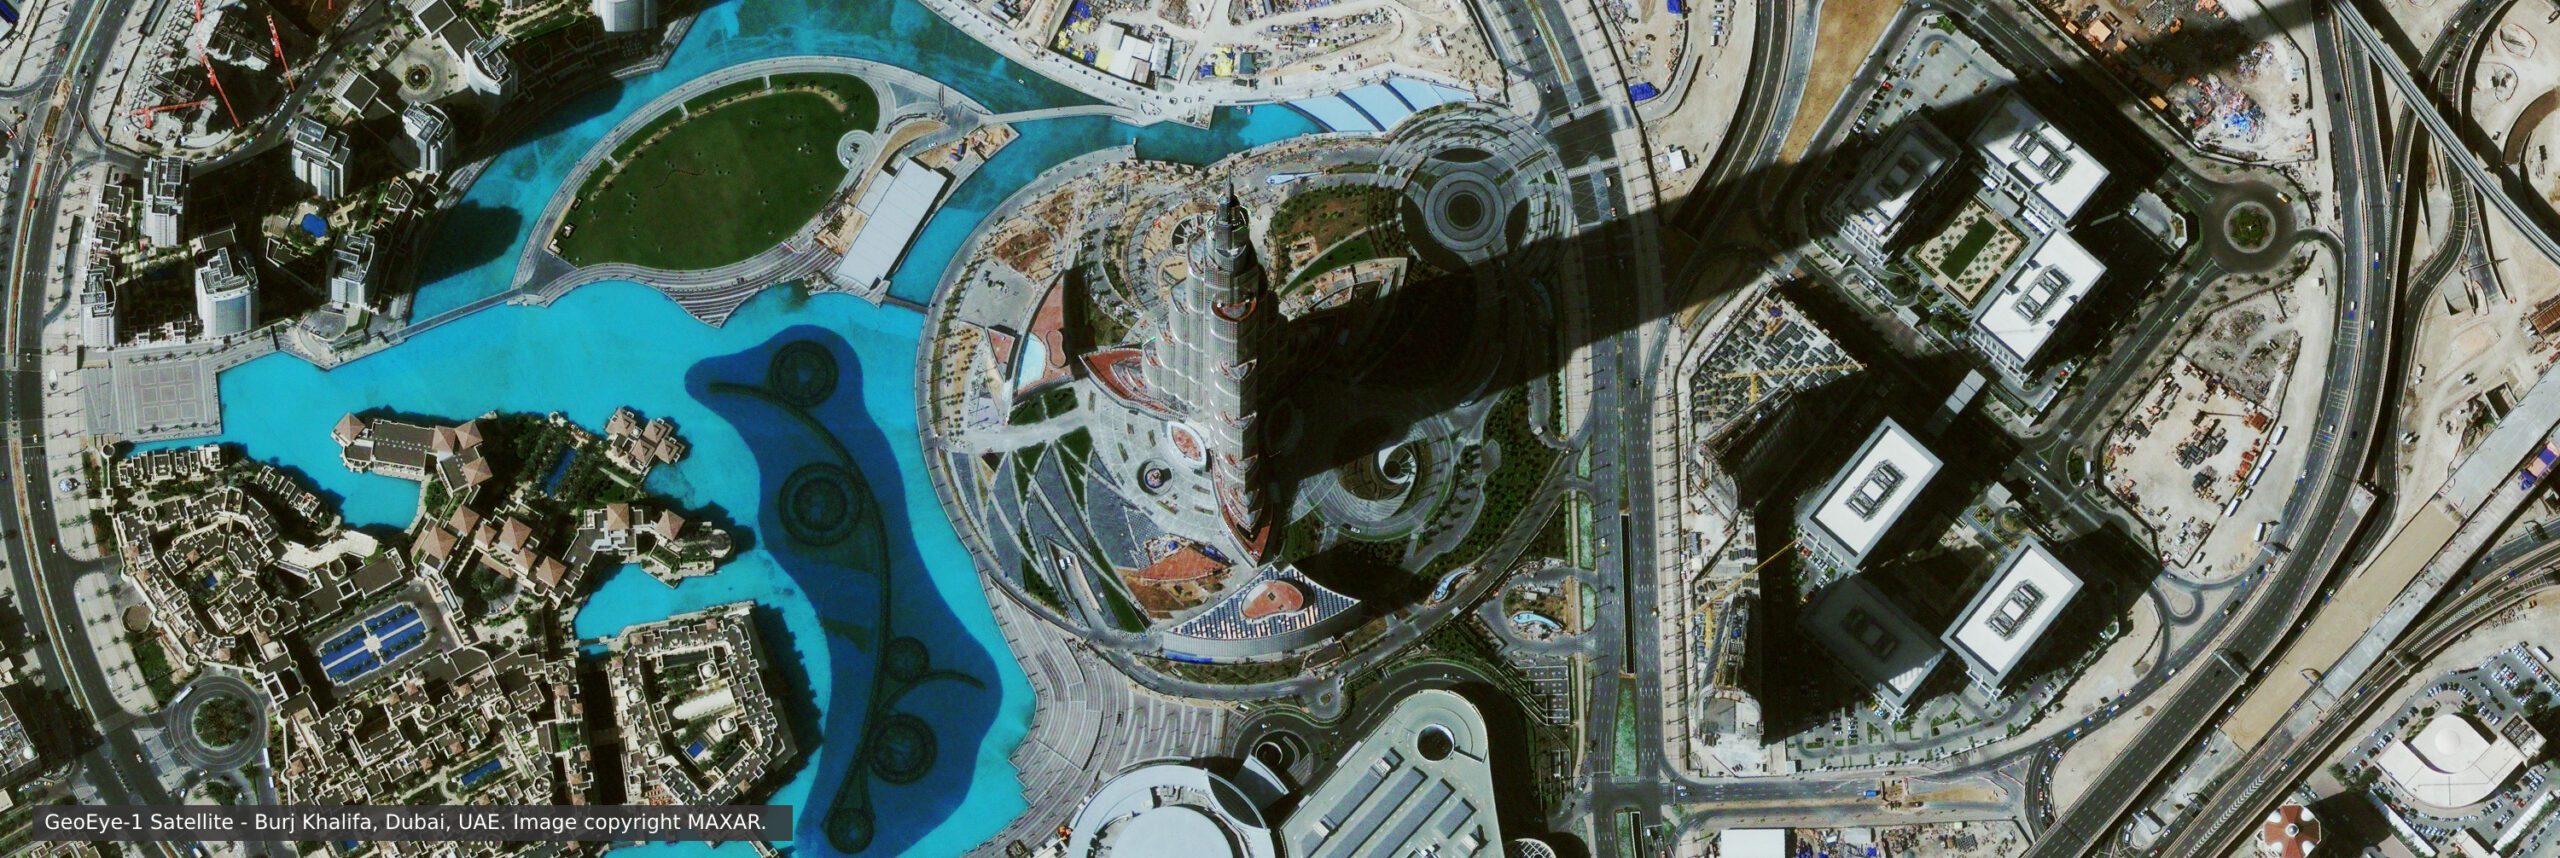
GeoEye-1 Satellite Sensor – Panchromatic and Multispectral Imaging

Image copyright © MAXAR – All rights reserved.
Since the 1990’s a new generation of satellite sensors with powerful capabilities have been launched to collect massive amounts of data about our planet and the many changes it has experienced.
There are dozens of remote sensing satellites orbiting the Earth collecting invaluable information about the Earth’s surface, oceans, atmosphere, and how they interact. Satellite images have been collected for scientific and technical purposes as well as just to appreciate their simple beauty. These satellites collect information that our eyes cannot, collections from 30M to 0.5M resolution are now available.
Satellite images provide important land coverage information for mapping and classification of land cover features, such as vegetation, soil, water, and forests for monitoring and managing Earth’s vital natural resources and the current global climate changes.
QuickBird Satellite Image Typhoon Morakot Flooding, Tawain

Image copyright © MAXAR – All rights reserved.
The Earth’s climate has changed throughout history. From glacial periods (or “ice ages”) where ice covered significant portions of the Earth to interglacial periods where ice retreated to the poles or melted entirely – the climate and the Earth has continuously changed.
The shallow end of the Glaciers is melting swiftly. Glaciologists have determined that areas of the glacial lobe were 98 feet lower in 2004 than they were in 2000. That’s double the rate of pre-1999 thinning.
Landsat Satellite Image of Antarctica
Image credit: NASA
The current warming trend is of particular significance because most of it is very likely human-induced and proceeding at a rate that is unprecedented in the past 1,300 years.
Scientists have been able to piece together a picture of the Earth’s climate dating back decades to millions of years ago by analyzing a number of surrogates, or “proxy,” measures of climate such as ice cores, boreholes, tree rings, glacier lengths, pollen remains, and ocean sediments, and by studying changes in the Earth’s orbit around the sun.
Earth-orbiting satellites and other technological advances have enabled scientists to see the big picture, collecting many different types of information about our planet and its climate on a global scale. Studying this data collected over many years reveals the signals of a changing climate.
Greenhouse gas concentrations in the atmosphere will increase during the next century unless greenhouse gas emissions decrease substantially from present levels. Increased greenhouse gas concentrations are very likely to raise the Earth’s average temperature, influence precipitation, and increase storm patterns as well as raise sea levels. The magnitude of these changes, however, is uncertain.
Digital Elevation Models
Satellite images allow scientists to remove vegetation, water, and geological cover from the image data which allows them to produce the most detailed available Digital Elevation Models (DEMs) of landscape topography. The creation of DEMs will revolutionize geological applications, land-use studies, soil science, and much more to better understand the global climate changes occurring around the world.
3D DEM Lake Tahoe, Nevada
Image copyright © MAXAR/Processed by Satellite Imaging Corporation. All rights reserved.