GIS Maps for Disease Mapping
Satellite images and Geographical Information Systems (GIS) can provide public health officials with vital information needed to detect and manage certain disease outbreaks. In order to properly plan, manage and monitor any public health system, it is very important to have up-to-date, relevant information available to decision-makers at all levels throughout all regions of the world.
Also known as Landscape Epidemiology, which involves the identification of geographical areas where the disease is transmitted. By knowing the vegetation and geologic conditions necessary for the maintenance of specific pathogens in nature, one can use the landscape to identify the spatial and temporal distribution of disease risk. Key environmental elements, including elevation, temperature, rainfall, and humidity, influence the presence, development, activity, and longevity of pathogens, vectors, zoonotic reservoirs of infection, and their interactions with humans.
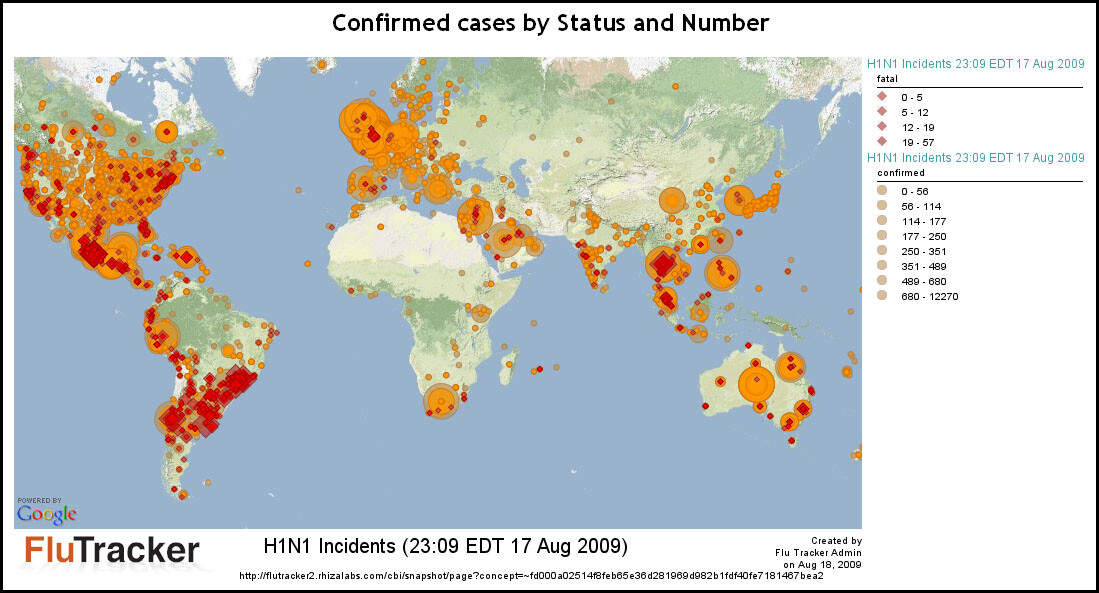
Satellite Imagery and GIS Epidemiology Mapping for Swine Flu
Image Credit: FluTracker
Vegetation type and distribution are also influenced by the environmental variables mentioned above and can be expressed as landscape elements that can be sensed remotely and whose relationships can be modeled spatially. For the past 29 years, satellite sensors have proved to be valuable tools for describing the Earth’s landscape. Since the launch of Landsat 7 and ASTER, NASA has initiated programs to integrate these technologies into the areas of forestry, agriculture, geology, and public health.
Satellite images can greatly enhance a GIS mapping project. Imagery is a powerful visual aid and serves as a source of derivative information such as planimetric and classification schemes to derive such information as land cover and change detection or vegetation classification.
The use of GIS has many implications for landscape epidemiology because it provides users the ability to store, integrate, query, display, and analyze data from the molecular level to that of satellite resolution through their shared spatial components. Field observations and vector data retrieved on environmental conditions, including vegetation, water (hydrology), and topography, can be combined in a GIS mapping environment to direct the interpretation of remotely sensed data and facilitate the characterization of the landscape in terms of vector and pathogen prevalence.
Example of GIS Epidemiology for Malaria
Image Credit: World Health Organization (WHO)
The associations between disease risk variables (e.g., vector, pathogen, and reservoir host abundance and distribution) and environmental variables can be quantified using the spatial analysis capabilities of the GIS. Landscape pattern analysis, combined with statistical analysis, allows us to define landscape predictors of disease risk that can be applied in larger regions where field data are unavailable. This makes remote sensing and GIS a powerful set of tools for disease surveillance, predicting potential disease outbreaks, and targeting intervention programs.
The analysis and mapping of data using GIS include:
- The spread of diseases over time
- Spatial patterns of outbreaks
- Population groups at risk
- Availability and access to healthcare
- Program intervention planning and assessment


